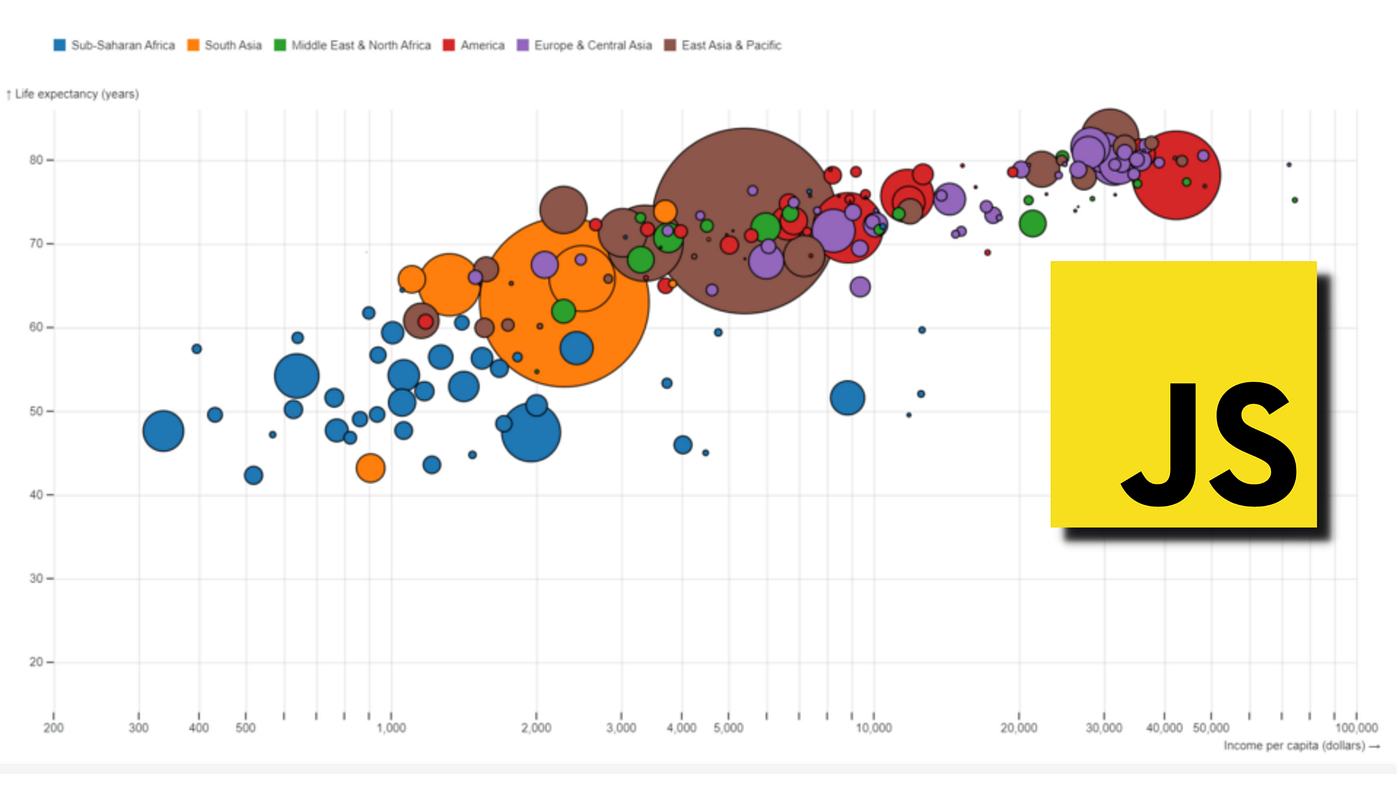
Data visualization is a powerful tool for making sense of complex data sets. In this blog post, we’ll delve into the world of front-end data visualization using D3.js and Chart.js. These two libraries offer unique approaches to creating interactive and visually stunning charts and graphs for your web applications. Whether you’re a seasoned developer or just starting your journey in web development, this post will provide valuable insights into harnessing the power of these tools to make your data come to life.


